We see the flow of the project as follows. ALL CAPS words link to work package tasks, representing phases of development in the project.
- We get settled in, PREPARE the technical side, and get the Living Labs sorted (WP1).
- Approaching water as a boundary object: We learn about how professional actors and everyday people think, relate and CONNECT about water, what data can represent that, and
how to visualise that through an actor landscape (WP2 Task 1). How do we bring together different actors? - The technical members OBSERVE how actors engage with the data, and wrangle it into the tool (WP3 Task 1). Then they DEVELOP the tool (WP3 Task 2) and improve the tool iteratively
through REFLECTing alongside actors (WP3 Task 3). - The local actors use the tool with the assistance of the project consortium, first to IMAGINE (WP2 Task 2) a better future, and then to ACT on it (WP2 Task 3).
- Throughout this process, we as a consortium, along with the Knowledge Hub component (WP 6) observe this: what do the actors think about the process, and the tool? What kind of knowledge (K) is developed? Does it work as a boundary object? Are they interested? Do they tell their friends? Does their agency, capacity for mobilisation (M) increase? How do they
connect to other actors with regards to water issues? What actions arise from engaging with the tool as a boundary object, locally, in the living labs? What about globally? Do they talk about this, do they play? Are their friends curious? Feedback at consortium meetings, meeting the overall goal of the project. - How can we translate this into the global, unassisted use of the tool? By defining the necessary knowledge (K), networks (R), and required resources for implementation (M), the institutional capacity needed to manage the tool independently is established. This enables the global, unassisted use of the tool (WP4)
- We devise a way of growing the broader use of the tool, using the visual nature of the tool, and the AI assistance, and we build this into the competition. (WP4 Task 1)
- We create a virtual community that aims to duplicate the sense of community that the living labs have, in global collections of community data platforms (CDPs). (WP4)
- We test this virtual context in Portugal, Sweden and South Africa, where our project consortium members have research interests. (WP4 Task 4.1)
- We compare results and use that to reflect on and improve the tool. (WP3 Task 4.4)
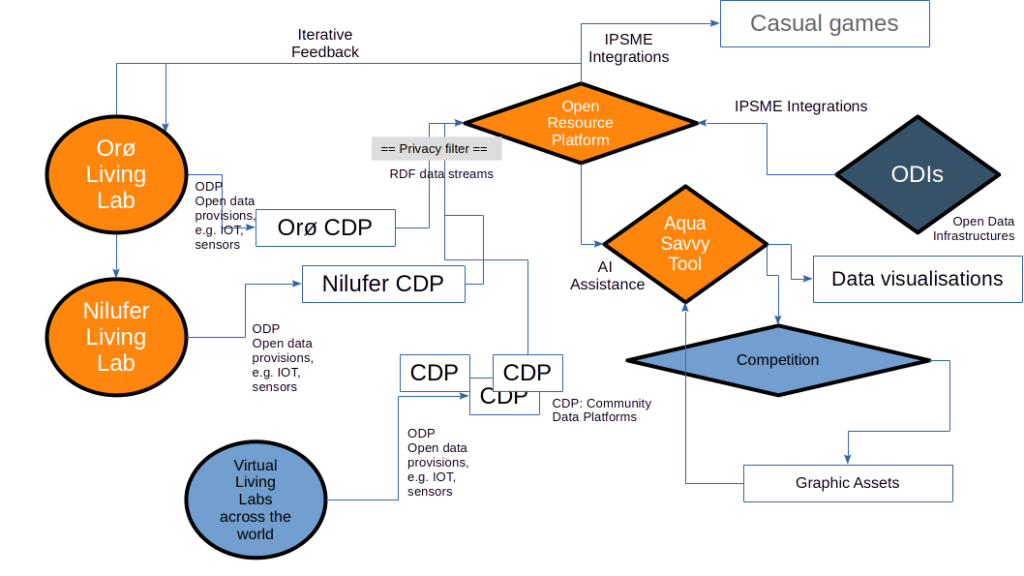
The diagram below is a first stab at showing the data flows from the living labs, through the community data platforms (CDPs) to the Open Resource Platform, that in turn is used to develop the visualisation tool. It also shows the integration of open data, or knowledge, infrastructures (ODIs) into the platform through the use of IPSME.